
Thanks for visiting our site.
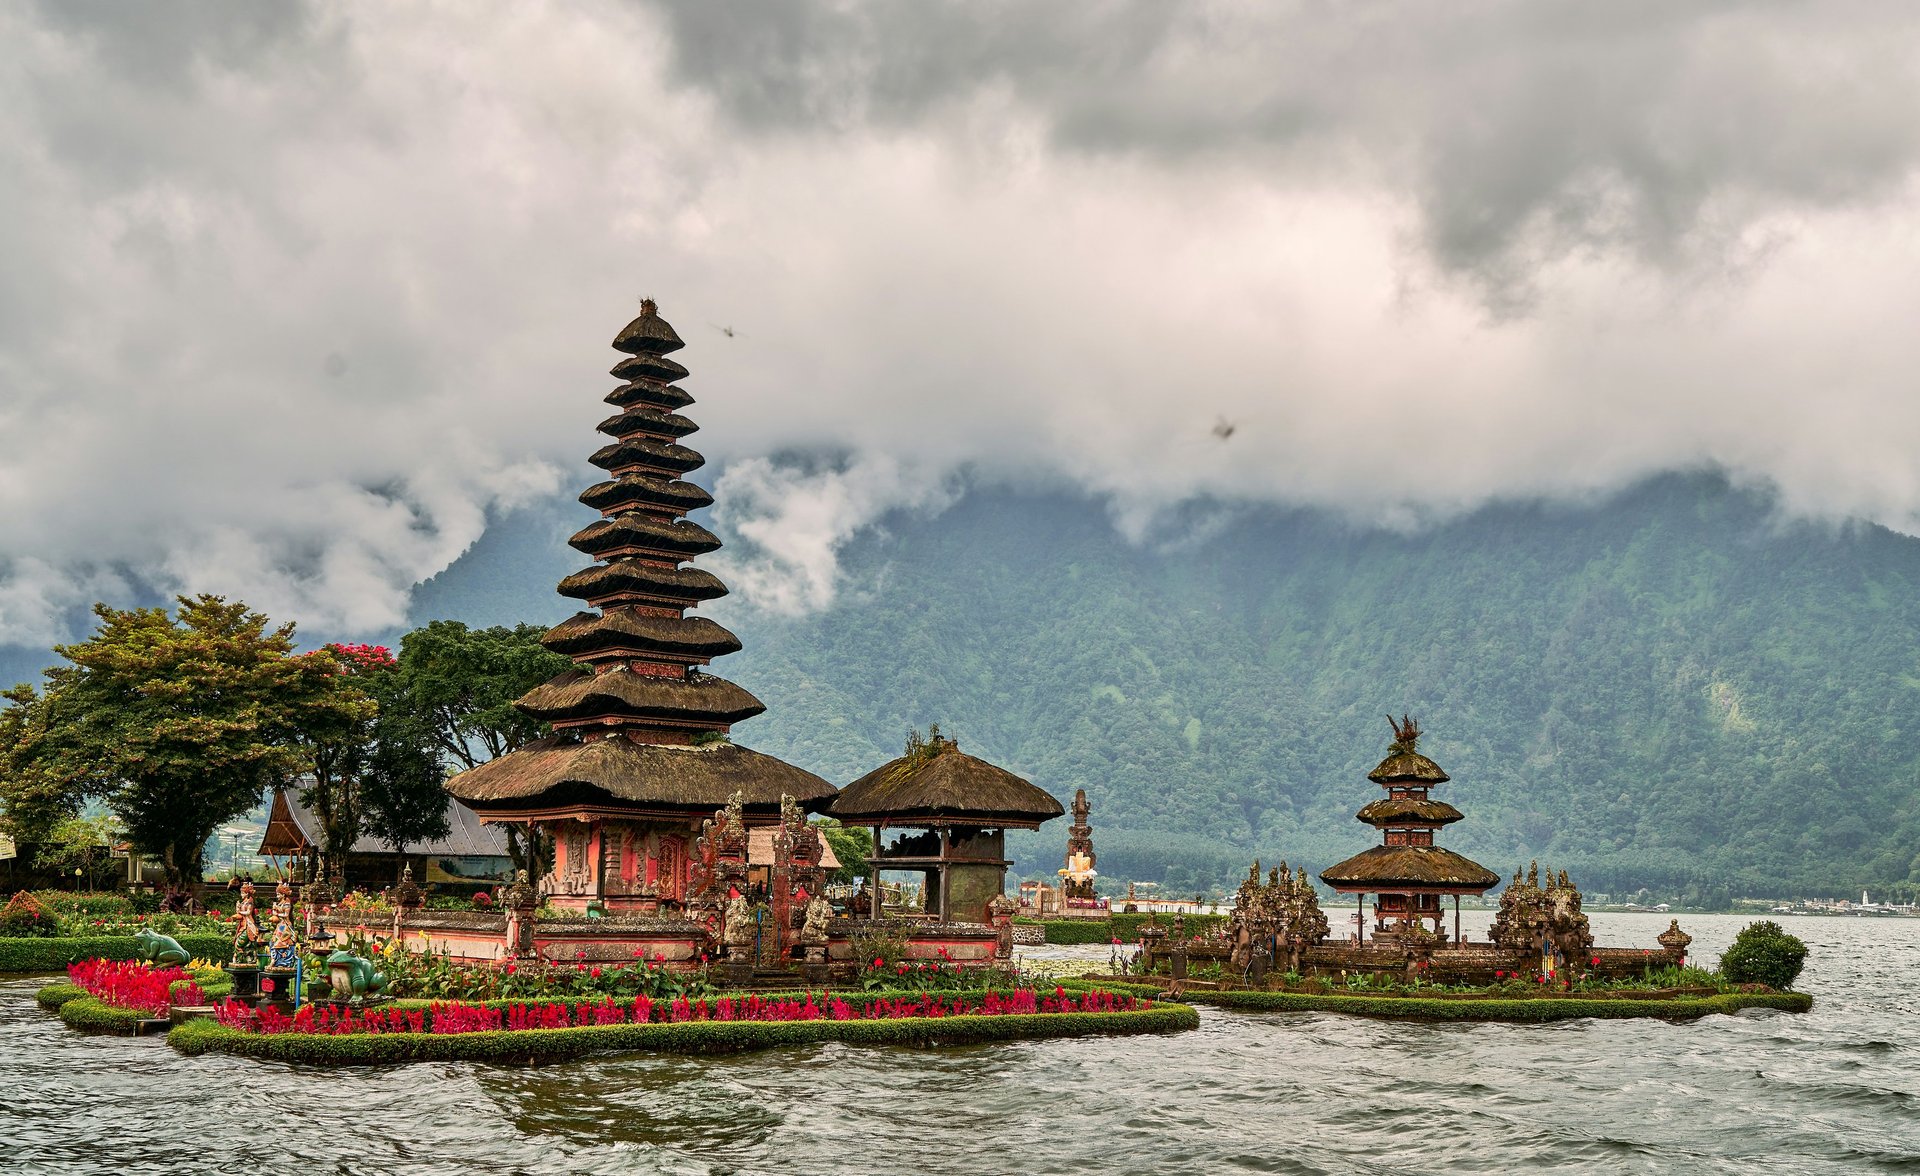
Discover the beauty of Bali with our private driver services. Immerse yourself in the unique culture and traditions of this paradise island with our top-notch hospitality. Bali is one of the most popular tourist destinations in all parts of the world, Bali has a very extraordinary tourist attraction with all its unique culture, traditions and customs. for further information, you can contact us via the contact listed on our site.
Our Warmest Regards
Bali Xplore team


Customized Travel Experiences
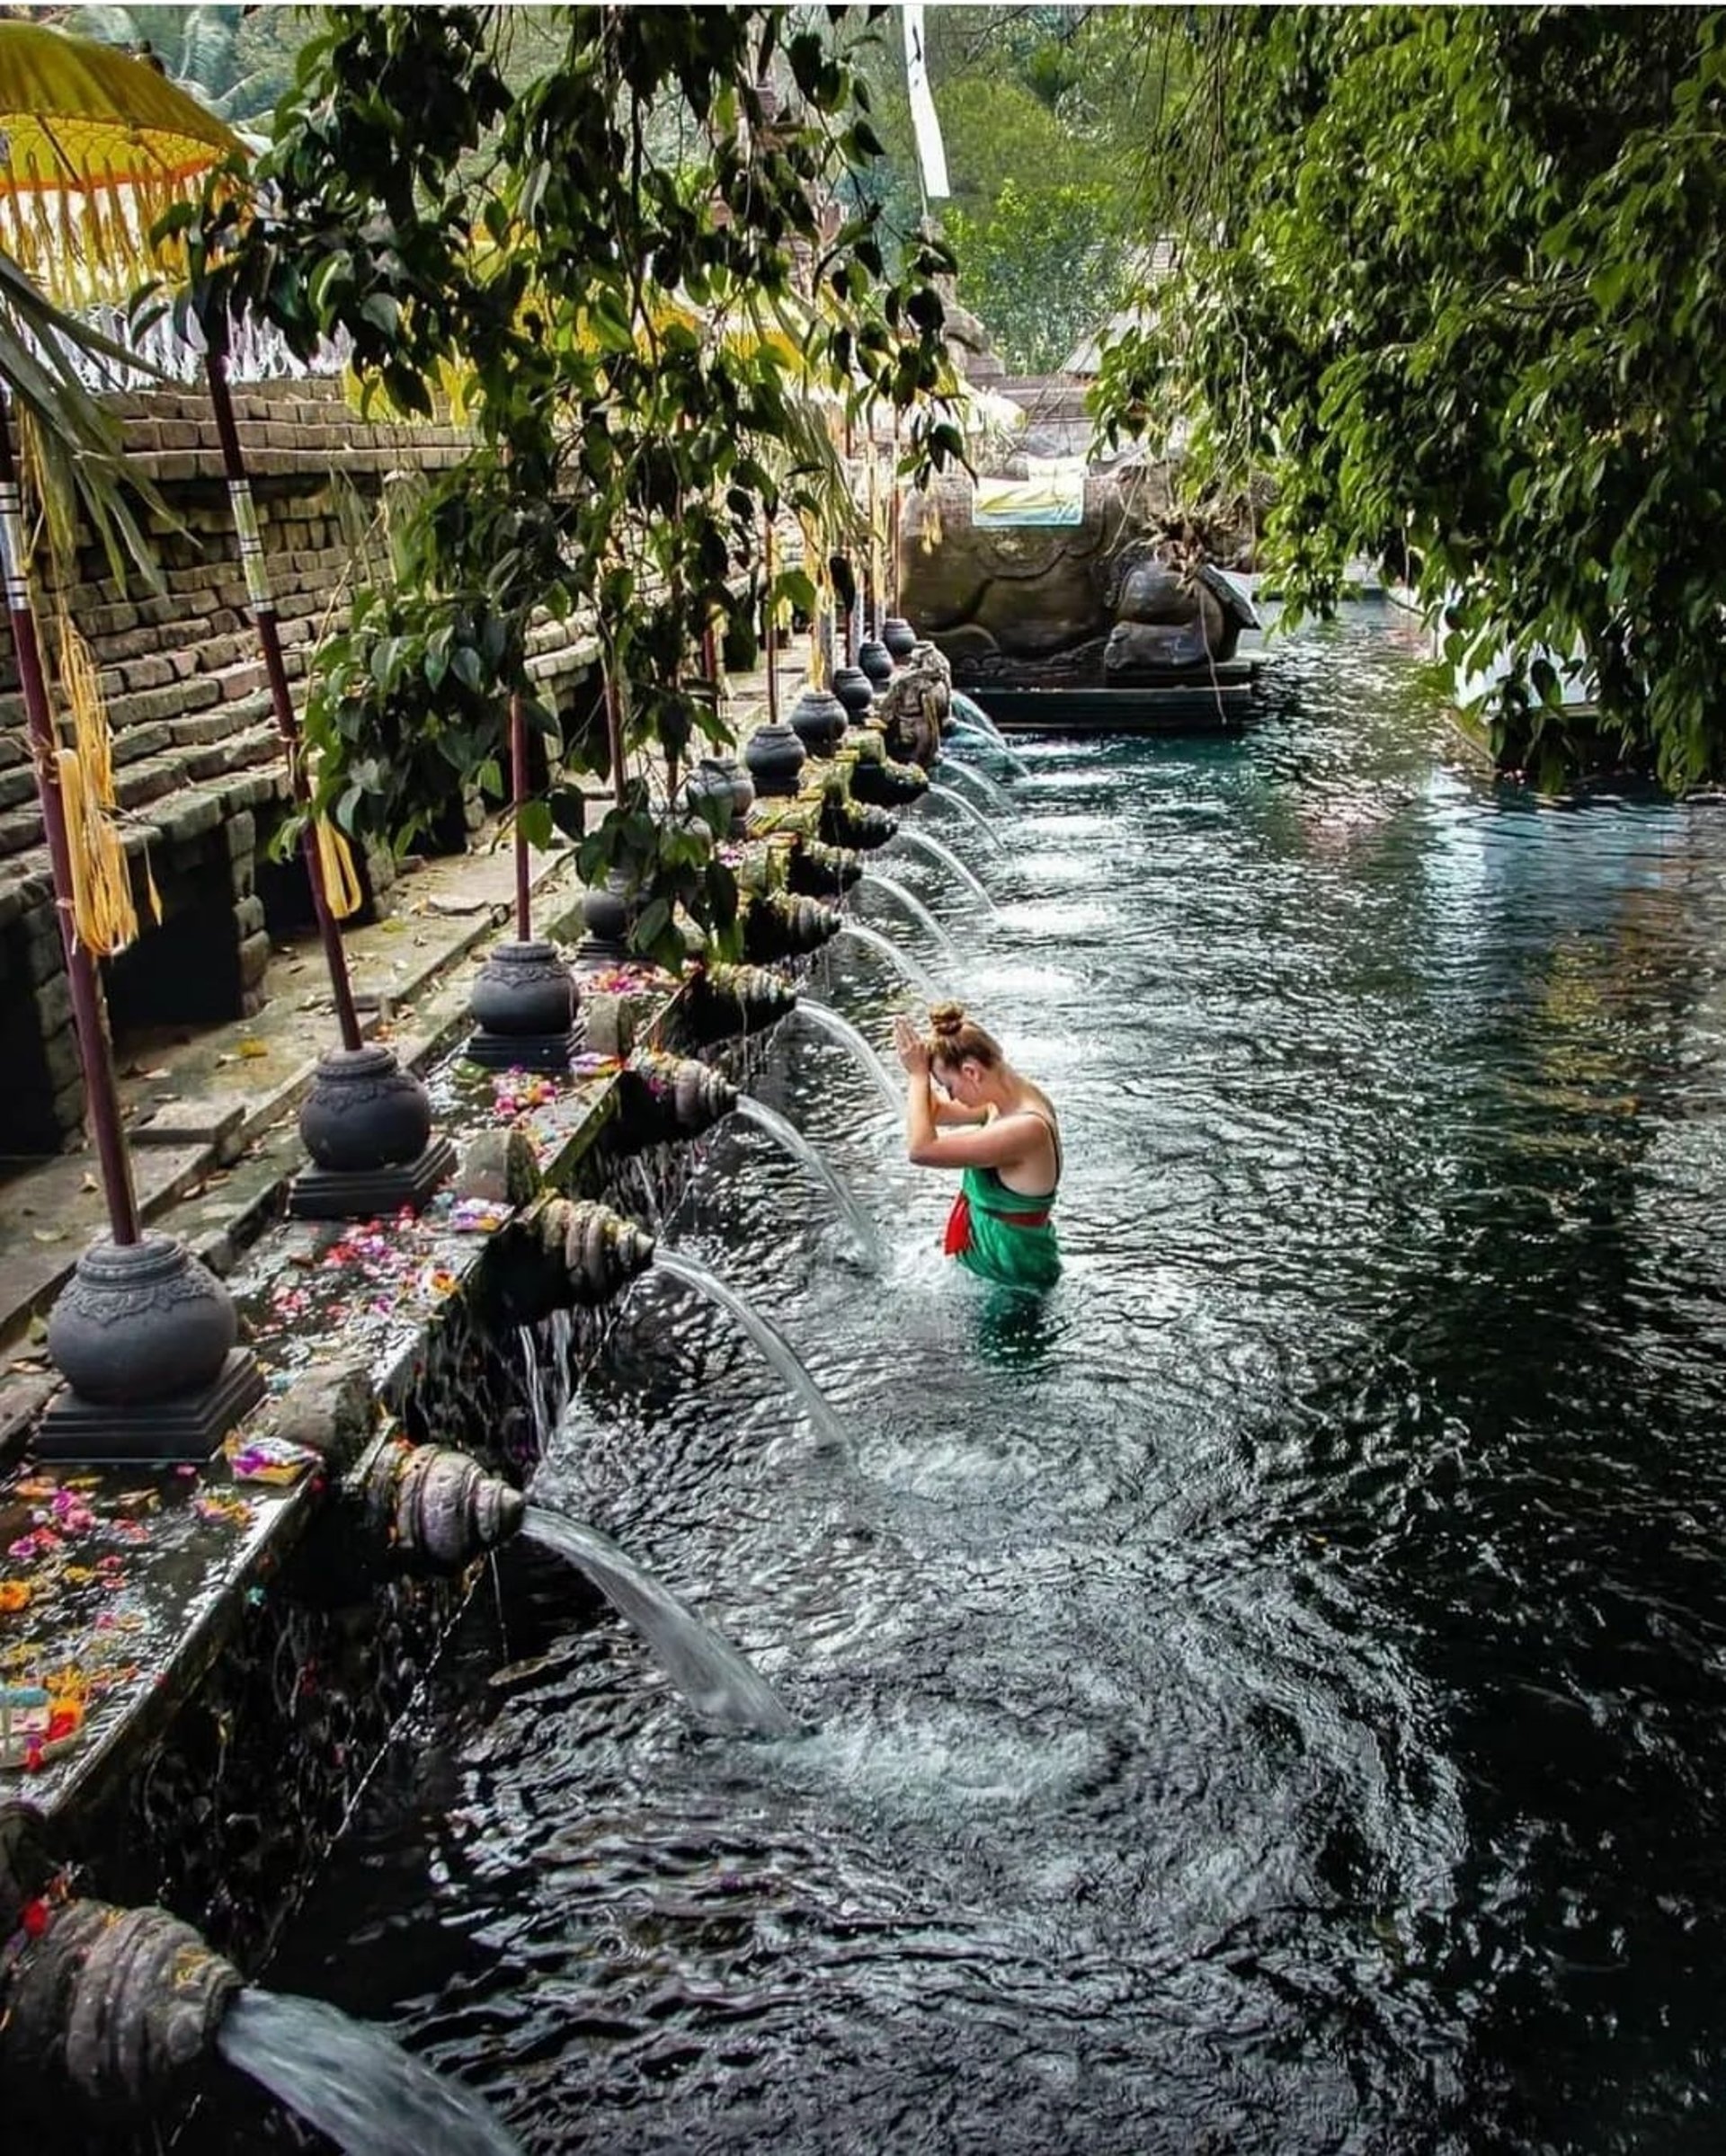
Let us be your guide to the wonders of Bali. Our private driver service ensures a seamless and memorable travel experience. From iconic landmarks to off-the-beaten-path destinations, we provide expert insights and top-notch service. Plan your Bali getaway with us today!